Python profiling.sampling explained: how to find slowness without guessing

When an application becomes slow, the same temptation appears almost every time: blame the part that looks suspicious. The database query. The server. The framework. The newest dependency. Intuition occasionally wins, but just as often it moves the discussion away from the real cause. Performance does not improve because a theory is defended more confidently. It improves when a team can see where time is actually going.
Python 3.15 now documents a new tool called profiling.sampling, powered by Tachyon, that helps answer that exact question. Instead of recording every single step a program takes, it samples the program periodically and then builds a broader picture. It is a little like looking at a city from a helicopter every few seconds: you do not hear every conversation inside every building, but you can still discover where traffic keeps accumulating.
This article is for product leaders, managers, founders, analysts and people who work near software without writing code all day. The goal is not to memorize commands. It is to understand what a profiler does, why statistical sampling is useful and how better measurement can save time, infrastructure and bad decisions.
What it means to profile a program
Profiling means measuring how a program spends resources while it runs. That is different from timing a single isolated task. If someone asks how long a recipe takes, one answer is “45 minutes.” If they want to improve the process, they need to know how much time goes into chopping, mixing, baking, waiting and cleaning. A profiler provides that second kind of answer for software.
Python’s official documentation distinguishes deterministic profiling from statistical profiling. A deterministic profiler watches events such as function calls and returns. It can provide very detailed information, but it follows execution closely. A statistical profiler takes periodic samples of where the program is and infers where time is concentrated. The profile documentation, now marked as deprecated in Python 3.15, explains that statistical profiling traditionally introduces less overhead because it does not need to instrument everything the program does.
The key word is sample. This is not guessing. It is repeated observation. If hundreds of observations keep finding the application in the same operation, that operation deserves attention. It may still be necessary work, but the conversation has moved from intuition to evidence.
What profiling.sampling adds
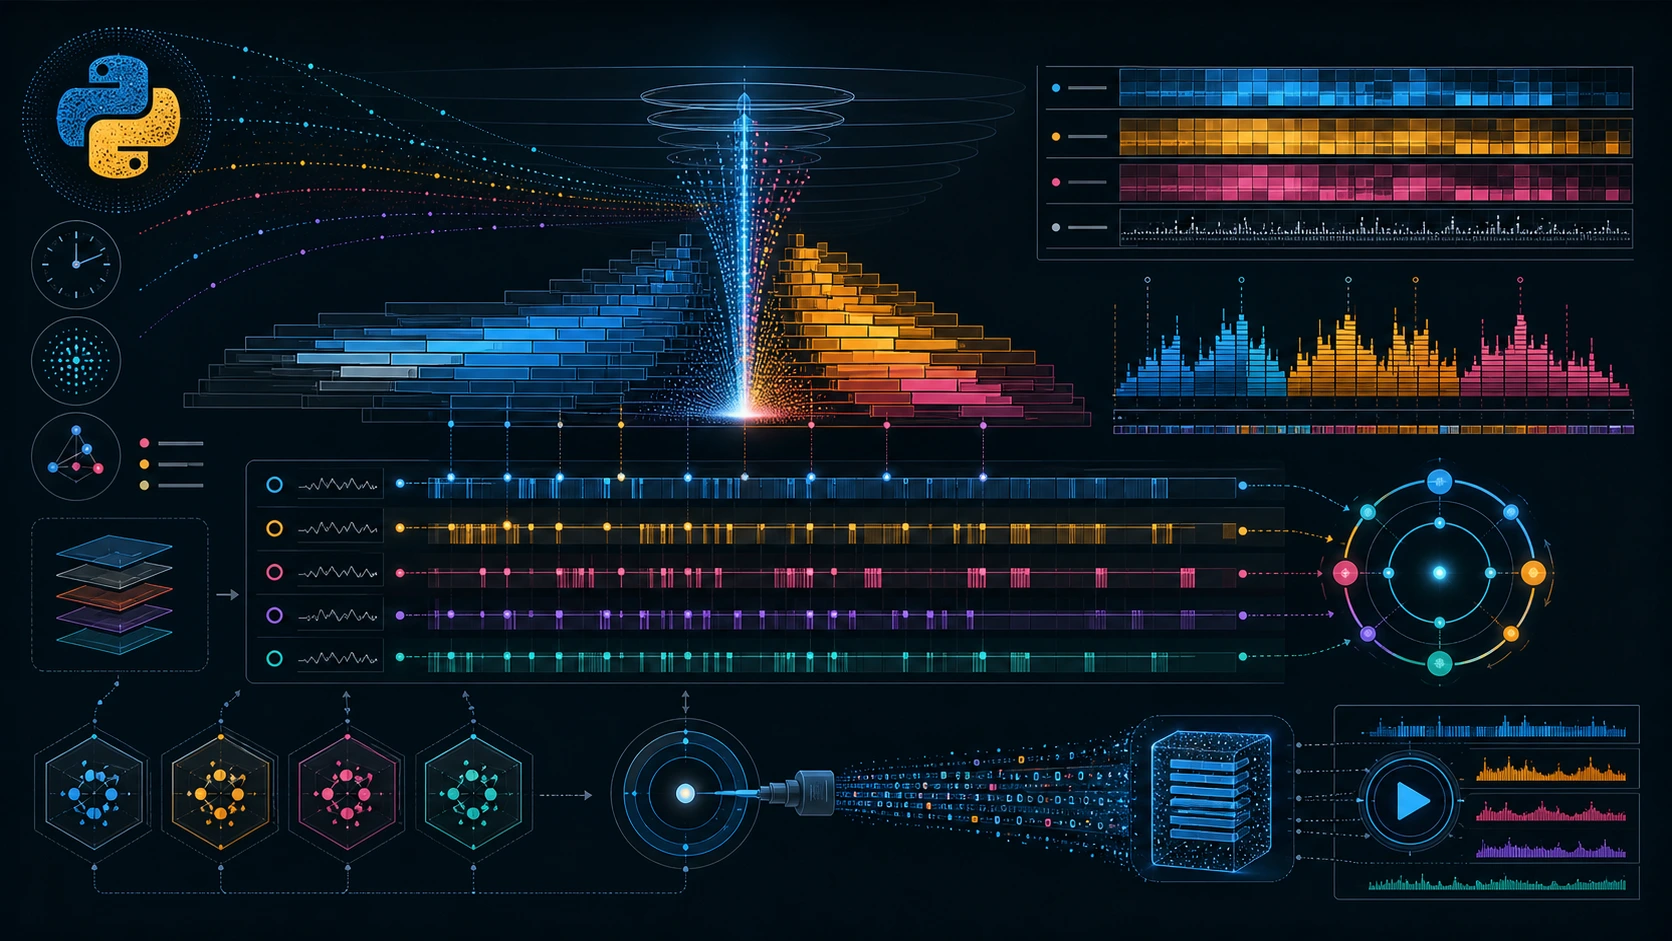
Python 3.15 describes profiling.sampling as a statistical profiler for running Python processes. It can attach to a process that is already alive, collect a profile over time and expose several views: an interactive dashboard, stack views, function tables, heatmaps, flame graphs, GIL analysis and later replay from a recorded file.
For non-specialists, three ideas matter most:
- It can inspect a live application. You do not need to rewrite the program or stop it just to start learning from it.
- It looks for patterns, not anecdotes. One snapshot can mislead. Hundreds or thousands of samples reveal where time consistently accumulates.
- It separates symptoms from causes. A slow screen may come from business logic, network waiting, locking or interpreter contention. A profile helps tell those stories apart.
The documentation describes the tool as useful for production debugging with “zero overhead” on the profiled process. That phrase deserves careful reading. It means the target process does not need to be instrumented or restarted. It does not mean observation is magically free everywhere. The profiler runs separately, samples from outside and is therefore usually much less intrusive than tools that intercept every execution event.
A simple analogy: traffic cameras versus a permanent detective
Imagine two ways to study a busy avenue. The first assigns a person to follow every car and record every turn, lane change and stop. That approach is complete, but expensive and intrusive. The second installs cameras that take photographs at intervals. The cameras do not know every maneuver, but they reveal where congestion forms, when it appears and which lanes fill up.
Deterministic profiling resembles the first method. Statistical profiling resembles the second. Neither is universally better. If you need to reconstruct exactly which function called which other function during a controlled test, deterministic detail can be ideal. If you want to inspect a real application while it is running without changing its behavior too much, sampling is often the more practical choice.
This distinction explains why the new tool matters. For years, many Python performance discussions depended on external utilities, bespoke scripts or practices that differed from team to team. PEP 799 proposed a dedicated profiling package so tracing and sampling could live under a clearer standard-library umbrella. The change is not merely about one new command. It is about making the conversation around Python performance more coherent.
What a profile can reveal
A useful profile does more than answer “which function is slowest?” It can expose several layers of the problem.
Hot functions
A hot function is an area of the program that appears frequently in samples. If an application spends a large share of its time converting formats, walking lists, serializing data or recomputing the same values, the profile makes that visible. This helps teams prioritize. Optimizing code that almost never runs may feel elegant, but it will not change the result users experience.
Call stacks
A call stack shows the route that led the program to a given point. That matters because the same slow function may be reached from many different places. Knowing only the function name is like knowing an elevator is busy. Seeing the stack is like knowing from which floor people entered and where they are going.
Flame graphs
Flame graphs turn samples into wide or narrow blocks. Width represents how often a path appears in the profile. They are useful because they reveal dominant execution routes at a glance. Brendan Gregg popularized flame graphs for systems performance work, and Python now exposes that view directly through profiling.sampling.
CPU time versus wall time
The tool lets users choose between CPU time (cpu) and elapsed real time (wall). That distinction is essential. An application can be slow because it is consuming processor cycles, or because it is waiting on a network, disk, lock or another dependency. To users both feel like slowness, but the remedies are very different. The first may call for a better algorithm. The second may require queue, dependency or concurrency work.
GIL usage
Python can also show which functions hold the Global Interpreter Lock through the gil view. Without drowning in jargon, the GIL is an internal rule that affects how Python threads run. If an application has many threads but one of them keeps control most of the time, the feeling of “we have concurrency, yet we do not scale” can appear. Seeing that concentration makes the discussion more precise.
What profiling.sampling does not do
A useful tool becomes dangerous when people assign it powers it does not have. profiling.sampling does not automatically make a program faster. It does not decide which optimization is worth implementing. It does not replace engineering judgment. It gives evidence. Interpretation remains a human task.
It also does not replace all other kinds of measurement. timeit is still appropriate for comparing small snippets under controlled conditions. Load testing is still necessary to understand behavior under many users. Production observability — metrics, traces and logs — remains essential for understanding failures and user experience. Profiling complements that toolbox; it does not erase the need for the rest of it.
There is another important limit: sampling works probabilistically. If a function appears only rarely, it may be underrepresented. If a bug occurs once a day for a few milliseconds, another diagnostic strategy may be better. Sampling is strongest when repeated patterns exist.
Why this matters to product and business teams
Performance decisions have a cost. A team can spend weeks rewriting the most visible part of a system and later discover that the bottleneck lived somewhere else. It can also buy more servers to hide an inefficiency that a small code change would have solved. Measuring before acting is not technical fussiness. It is sound management.
A reliable profile improves conversations between disciplines. Product can ask, “Which part of the experience really slows people down?” Engineering can answer with more precision than “we think it is the API.” Operations can separate capacity problems from design problems. Finance can understand why one targeted optimization prevents unnecessary infrastructure growth.
Performance also has a sustainability angle. Workloads that use more CPU than necessary cost more energy and more money. Not every software problem deserves micro-optimization, but when an organization runs thousands of jobs, pipelines or requests per minute, fixing a real hotspot can compound.
How it might be used in a real situation
Imagine a reporting platform. Users complain that some reports take too long, but not all of them. The team could begin by inspecting the frontend, the database or the network. With a sampling profiler, it first observes a real slow execution. The profile shows that much of the time is spent converting data into an intermediate Python format, not querying the database as everyone assumed.
That finding changes the discussion. Maybe the answer is caching, fewer transformations, a different structure or moving one step out of the critical path. If the profile instead showed long wall-clock waits and little CPU use, the hypothesis would be different: perhaps an external API is slow or several workers are fighting over the same resource.
The important thing is that the team stops debating suspicions and starts working from a map.
Facts, interpretation and projections
Verified facts
- Python 3.15.0b1 documentation includes
profiling.samplingand presents it as a Tachyon-based statistical profiler for running Python processes. - The tool exposes
live,top,recordandreplayinterfaces, along with views such asflamegraph,heatmap,gil,functionsandstack. profileis deprecated in Python 3.15, and the documentation recommendsprofiling.samplingfor production debugging andprofiling.tracingfor development and testing.PEP 799formalized the newprofilingpackage for organizing profiling tools inside Python.
Interpretation
- The largest value for non-specialist teams is that observing real software becomes easier and less intimidating.
- Because the tool is documented inside the standard library, it can shorten the path from “we feel the system is slow” to “we have evidence we can share.”
Reasonable projections
- Teams already running Python in production are likely to start attaching recorded profiles to incidents, capacity reviews and regression analysis.
- Python performance education may become less dependent on scattered tooling and more centered on a common workflow. As with any projection, adoption and real-world stability will decide how far that goes.
Conclusion
profiling.sampling is not the kind of feature that shines in a five-minute demo. It is more valuable than that: it is a cleaner way to see where time goes in real programs. For people who do not code every day, the core lesson is simple. Before optimizing, observe. Before blaming, measure. Before spending weeks, make sure you are attacking the right part of the problem.
Python 3.15 brings that discipline closer to the center of the language. It does not remove the need for judgment, but it does make it easier for performance decisions to rest on evidence instead of confident guesses.
FAQ
Does profiling.sampling make an application faster by itself?
No. It shows where time is concentrated. The team still has to decide what to change and validate the result.
Is this the same as timing one function?
Not quite. Timing one function is useful for small comparisons. Profiling explains how a whole application behaves while doing real work.
Why is it called statistical profiling?
Because it takes periodic samples and uses the frequency with which different code paths appear to infer where time is spent.
Can it inspect an application that is already running?
Yes. The official documentation says it can attach to an existing Python process by PID when the operating system allows that access.
Does it replace logs, metrics and traces?
No. It complements them. Logs explain events, metrics show trends, traces follow requests and profiles reveal where code spends time.
Sources
You might also like
Python profiling.sampling: technical guide to Tachyon, GIL, flame graphs and production profiles
Technical guide to profiling.sampling in Python 3.15: Tachyon, attach, clocks, GIL, flame graphs, replay and usage choices.
May 15, 2026

Python profiling.sampling in Chile: productivity, digital talent and better services
How profiling.sampling matters in Chile: productivity, digital government, critical industries, training and software decisions.
May 15, 2026

Dirty Frag in Chile: impact on cloud, companies and cybersecurity
Dirty Frag impact in Chile: cloud, banking, health, public sector, essential services, regulation and Linux patching.
May 7, 2026